A current built-inventory layer for your exposure file.

Structure footprints, counts and rough form from annual high-resolution satellite imagery, geocoded and dated, for the territory you take to renewal.

Exposure Mapping

REV. AnnualSpec
GSD
0.5–2 m, high-resolution satellite
Spectral
RGB
Cadence
annual refresh
Delivery unit
one territory or treaty area per project
Formats
GeoPackage and CSV
Vintage
imagery date carried on every tile
Delivery
files, no dashboard login

The files

Four files, all keyed to the same vintage dates. They open in GIS and go into your cat model pipeline as a file.

Structure layer

Format
GeoPackage
What's in it
One polygon per structure found in the imagery, geocoded, with a structure ID and the vintage date of the tile it came from. Footprints are taken from the roof outline in the image, so they show the built area, not the lot. This is the base layer the other three files read from.

Density metrics

Format
CSV
What's in it
Structure count and total footprint area for each accumulation zone. You supply the zones, whether CRESTA, postcode or your own polygons, and get one row per zone with the vintage range of the tiles under it. Re-run your accumulation against the refreshed counts and see which zones moved.

Form classification

Format
attribute on the structure layer
What's in it
A broad building-type bucket for each structure where the footprint is big enough to read, and a plain "unclassified" where it is not. It separates, for instance, a detached house from a large-span commercial roof. It does not say what the building is made of or how well it was built.

Vintage-tagged export

Format
CSV
What's in it
A flat file of structure centroids, counts and form buckets, dated, laid out for the location-file import of your cat model. Annual refreshes arrive as a new dated file, so you can diff this year against last.

How it works

  1. In

    You define the territory

    Send the treaty area or territory as a shapefile or GeoPackage, and the accumulation zones you report on. Say which cat model import layout you need.

  2. Process

    Imagery is assembled

    Annual high-resolution imagery is gathered for the area, using the nearest clear image for each tile. Each tile keeps its own date.

  3. Process

    Structures are found

    Structures are outlined, counted and given a broad form bucket where the image allows. Small or ambiguous objects stay out rather than being guessed at.

  4. Out

    You receive the files

    The structure layer, density metrics, form attribute and vintage-tagged export, with the tile dates and any gaps listed in a short note.

Limits

These are the conditions that change what the layer shows, stated here so you can decide how much to lean on it.

Cloud and tile vintage

Effect on the layer
Imagery is assembled from the nearest clear image per tile, so some tiles carry an older vintage than others.
Read it as
The density file gives the vintage range per zone. Uniform currency across a territory is not promised.

0.5–2 m is the floor

Effect on the layer
A house covers far fewer pixels at the coarse end of the range than at the fine end. Sheds, garages and other small outbuildings may be missed or merged into the main structure.
Read it as
Counts describe what the imagery resolves.

Form needs pixels

Effect on the layer
At the coarse end of the range, expect footprint and count but more "unclassified" structures.
Read it as
Form buckets are broad by design.

Recent construction

Effect on the layer
The layer shows what stood when the image was taken.
Read it as
Buildings put up after that, including anything from the last cycle, appear at the next refresh.

Rural and low-density areas

Effect on the layer
Structure density is lower and classification is less certain outside built-up areas.
Read it as
Isolated structures under trees can be hidden.

Inventory, not valuation

Effect on the layer
The layer counts and outlines structures.
Read it as
It carries no sum insured, replacement cost, construction quality, year built or loss estimate.

Why this exists

The exposure file for a renewal is a schedule your brokers and underwriters filled in. Some rows geocode to a postcode centroid, and some districts have built out since the schedule was written. You clean the file, run accumulation by zone, and find out from the results that a growing area holds more than the schedule shows.

The only outside check is whatever public building data exists for that market, which varies a lot by country. This layer gives you an independent count, dated, to hold the schedule against before the file goes out.
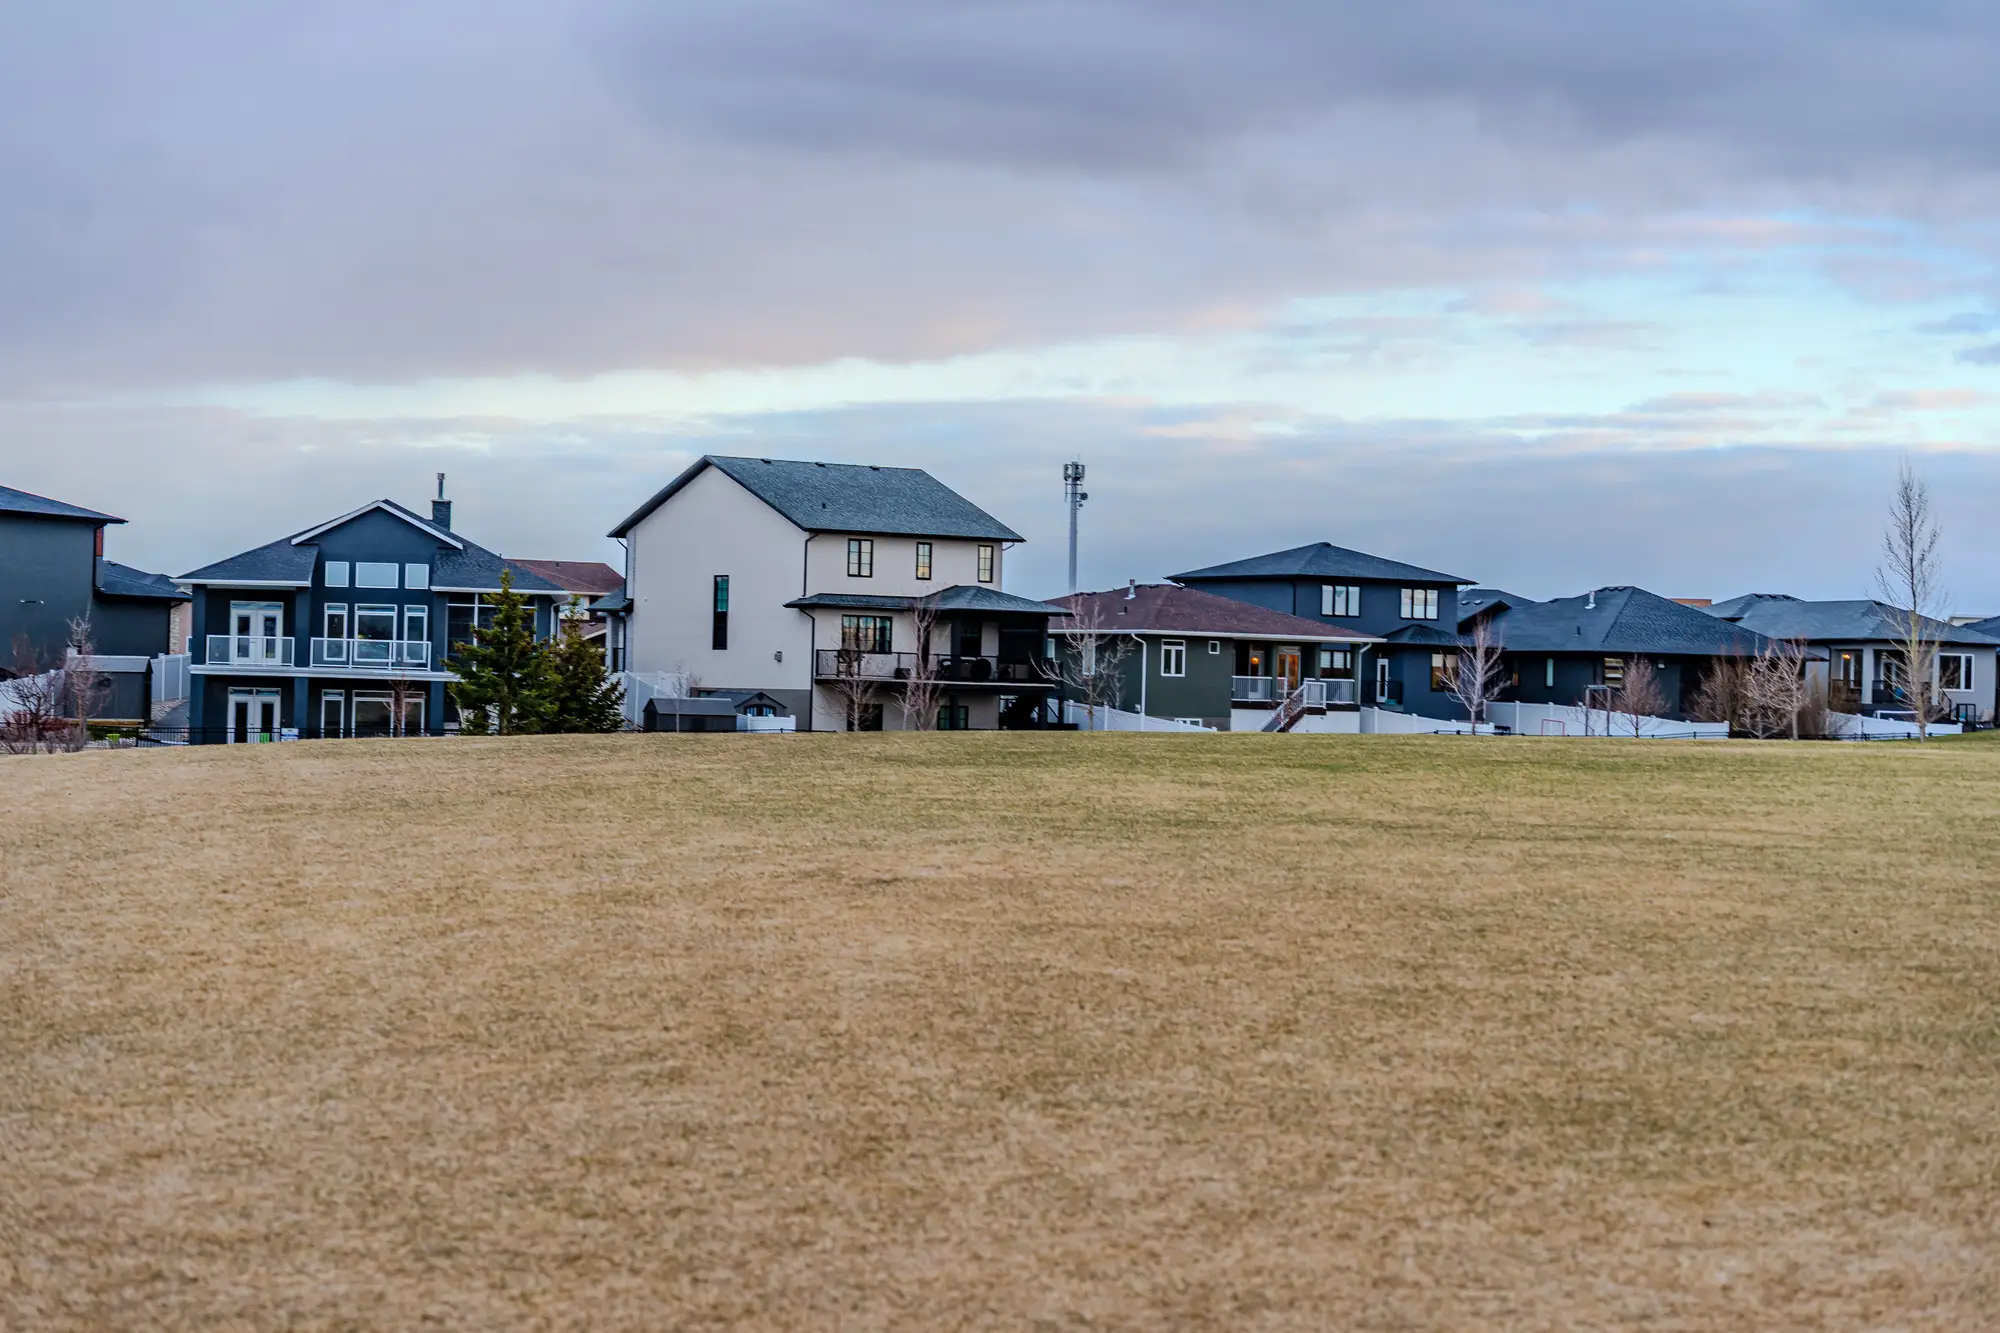
Two-storey houses along the edge of a grass field under an overcast sky
Scenery. Houses at the edge of a town.

Who it's for

For

  • Catastrophe modellers and exposure analysts building the location file for a treaty renewal.
  • Teams that want an independent count of structures per accumulation zone to check schedule gaps and staleness.
  • Reinsurance and exposure management leads who want a dated, repeatable input each cycle.

Not for

  • Anyone looking for building valuation, construction quality or loss-cost output. This is inventory, not a cat model or an AVM.
  • A replacement for the policy-level exposure schedule. It supplements and checks the schedule.
  • Real-time or event-response exposure. The layer refreshes annually.
  • Claims or underwriting of a single risk that needs a survey of one building.

Questions from the modelling desk

Does this replace my exposure schedule?

No. It is an independent inventory layer for filling gaps and checking staleness. The schedule stays the policy-level record.

What resolution is it built from?

0.5–2 m, enough to resolve structures but not fine architectural detail. The fine end does better on small structures and form.

How current is the layer?

Refreshed annually. Each tile carries its own imagery date, and very recent construction may lag a cycle.

What if part of the territory is cloudy?

Coverage is assembled from the nearest clear image per tile, so some areas carry an older vintage than others. The density file shows the vintage range for each zone.

Can it tell building value or construction quality?

No. It gives footprint, count and a broad form bucket. No valuation and no construction class.

How do we check it against our own data?

Match the structure layer against your geocoded schedule and compare counts per zone. Tell us where your ground truth is and the comparison can be set out beside the zones you report on.

Will it load into our cat model?

The export is laid out for a location-file import. Tell us your model and import layout when the territory is scoped.

Who owns the layer?

Use and ownership terms for the delivered files are set in the contract before work starts. The public and commercial imagery behind them keeps its own licence terms.

How is it priced?

Each territory is scoped and quoted on its own. Ask for a written scope.

Get a current layer ahead of your next renewal.

Send the territory and we will say what the imagery covers and how old each tile is.