Field notes: the valley that rebuilt before the last claim even closed
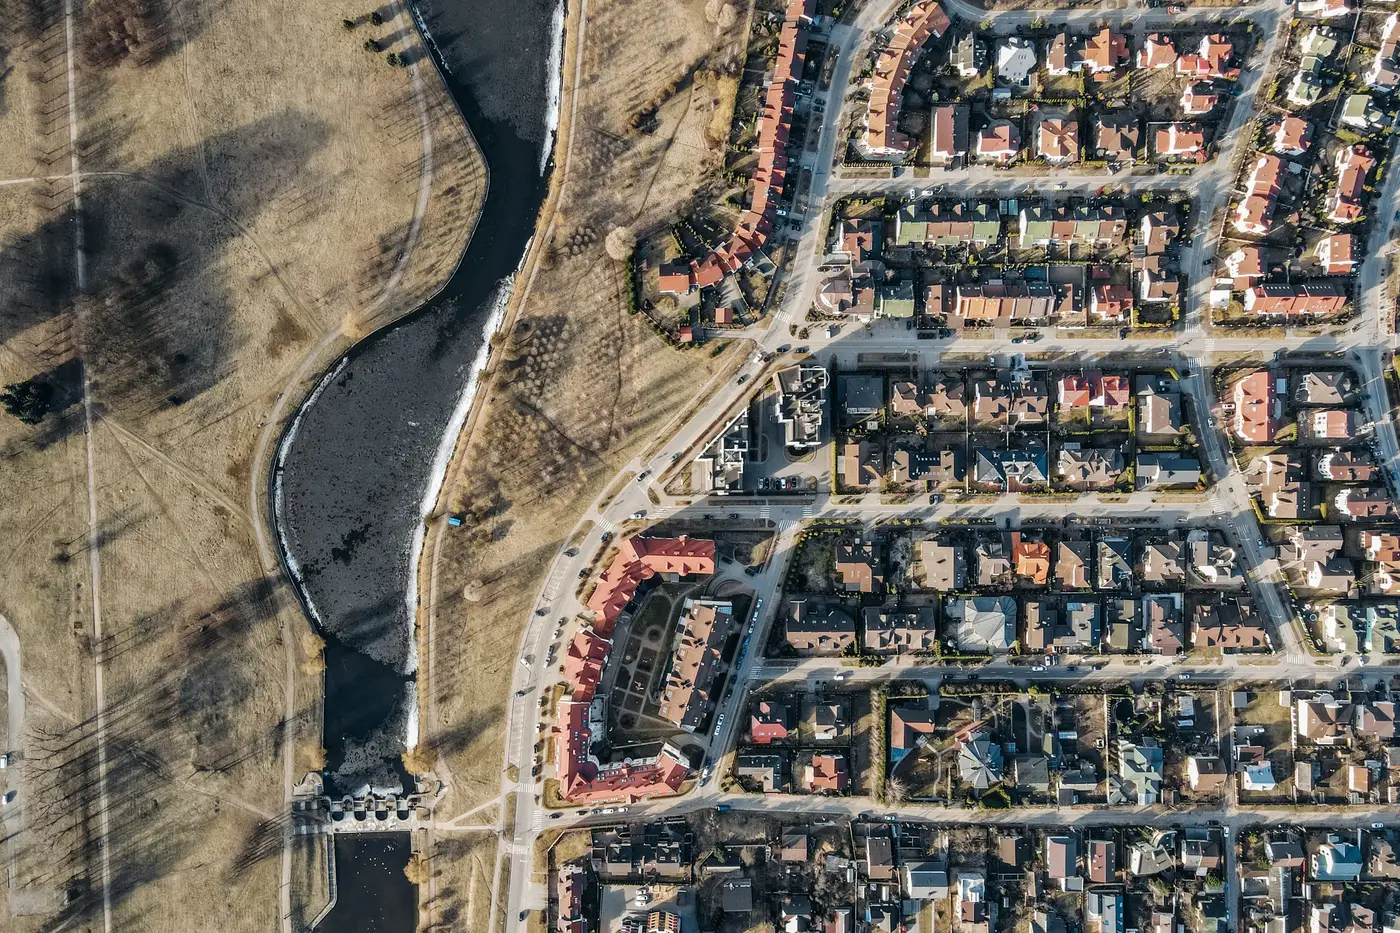
There's a version of this story that every cat modeller who's worked a flood book has lived through in some form, and it rarely makes it into the post-event report because by the time the report is written, the thing it's describing has already changed shape.
A river comes up. It takes out a stretch of low-lying development along the floodplain, the kind of mixed residential-light-industrial strip that shows up in every schedule as a handful of line items with a construction year from a decade or two back. Claims open. Adjusters go out, write their estimates, and the numbers work through the layer. Litigation drags a chunk of files past the one-year mark, which is normal for flood, nobody's surprised by that.
What's less normal, and what keeps turning up when you get out and look at the ground instead of the file, is how much of that stretch is back under roof before the oldest claims are closed. Not repaired. Rebuilt, often bigger: the single-story warehouse that comes back as two stories with a mezzanine, the row of single-family homes that comes back as a tighter cluster of townhomes because the lot values support it now and the owner who sold out wants more unit count per parcel. The footprint changes. The height changes. In some cases the use changes, light industrial converting to self-storage or flex space because that's what financing was available for in year two.
None of that shows up anywhere in the schedule until someone updates it, and updating a schedule depends on someone telling you. Self-reported exposure runs on a chain of people remembering to flag a change, and a flood zone mid-rebuild is a bad place to expect that chain to hold. The broker's submission reflects what the last survey captured. The survey reflects whatever the insured's facilities contact had time to report, which after a flood is usually "get the building back" and not "update the carrier on the new construction type." So the schedule keeps carrying a structure that no longer exists, sitting next to a structure that does exist but isn't in anyone's file yet.
This is where a treaty renewal conversation gets uncomfortable, because the exposure base everyone's pricing off is a snapshot of a valley that's already gone. The TIV number is wrong in both directions at once, overstating what's been demolished and understating what's gone up in its place, and the two errors don't cancel out because they're not the same buildings. You can true this up with another round of schedule requests and another few months of waiting on the cedant, or you can go look.
That's the thing field work keeps teaching that spreadsheets don't: rebuild cycles in a hot flood corridor run faster than renewal cycles. A valley that takes a hit in spring can have cranes on site by the following spring and occupied space by the one after that, well inside the window between one treaty and the next. If your exposure input is only as current as the last schedule refresh, you're underwriting last year's valley, not this one.
What you want for a renewal is a current read on what's built, independent of who remembered to report what, refreshed on the same yearly cadence the rebuild itself runs on. That's the gap a consistent, current built-inventory layer closes: footprints, counts, and rough form pulled straight from the imagery rather than assembled from whoever filled out the last survey.
Next time a renewal exposure file looks suspiciously stable for a valley you know just rebuilt, it's worth checking what Exposure Mapping would show for the same ground.