How to estimate replacement cost from a building footprint and story count
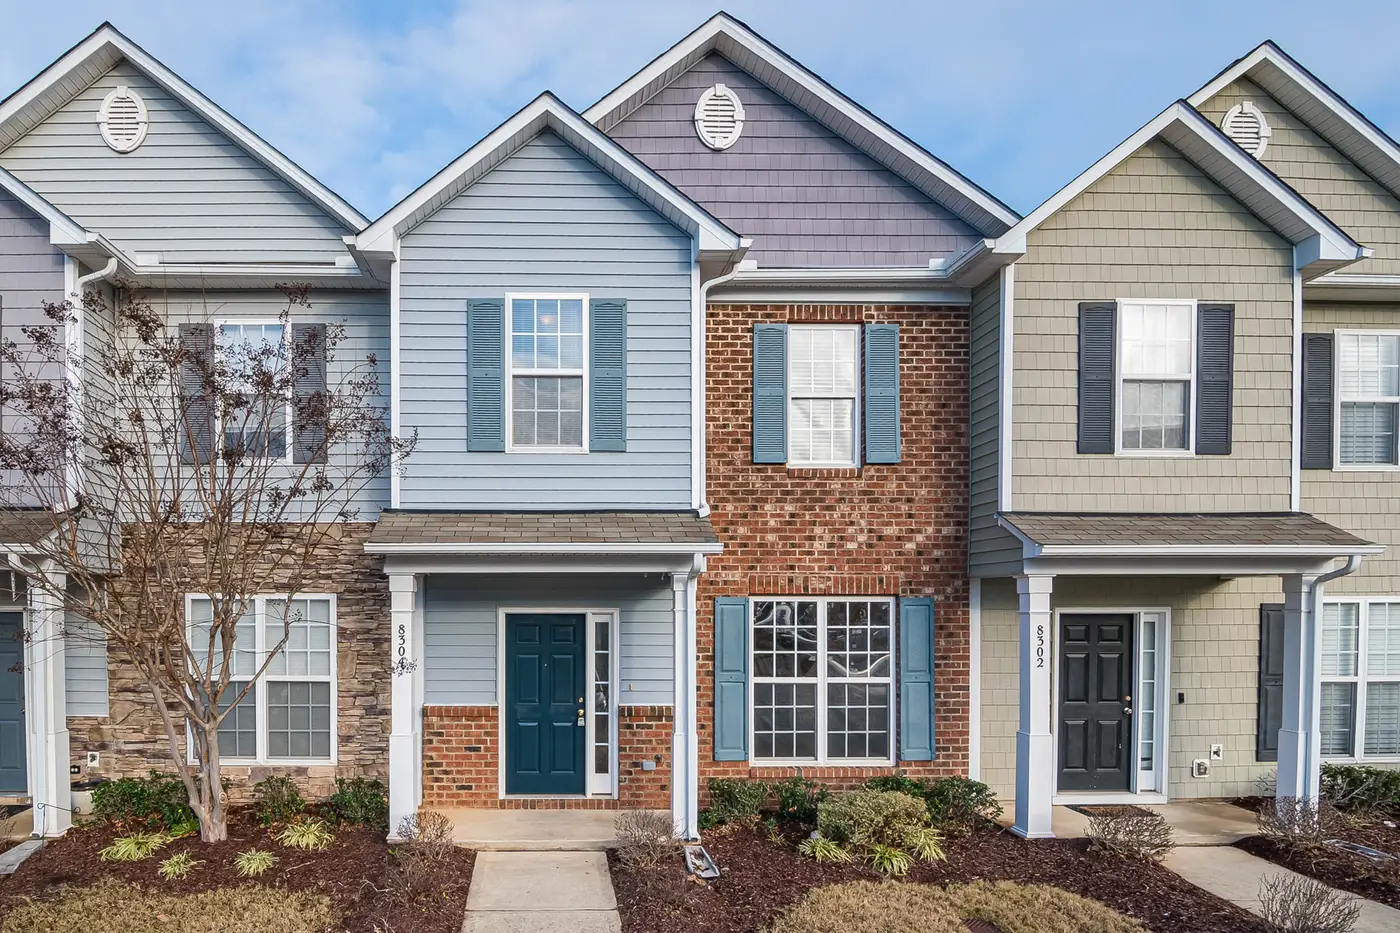
The fallback is the same one assessors have used for decades: back into replacement cost from the building's footprint and its story count. It's rough, it's defensible, and it runs fast enough to work across a whole treaty before a renewal deadline, which matters when a schedule shows up with a TIV and nothing else, or the occupancy code doesn't match what's clearly on the ground.
The basic build-up
Start with footprint area, the ground-level outline of the structure in square feet or square meters. Multiply by story count to get gross floor area. A 40,000 sq ft footprint at four stories is 160,000 sq ft of floor area, full stop, before you touch cost tables.
From there, apply a cost-per-square-foot multiplier pulled from a construction cost reference, RSMeans and Marshall & Swift are the two most underwriters already have a license for, filtered by construction class and occupancy. Tilt-up warehouse runs a fraction of the per-square-foot cost of a steel-frame hospital. Get the occupancy wrong and the multiplier error swamps anything you saved by skipping the footprint measurement.
The output is a replacement cost estimate, not a market value and not what the insured paid for the building. It's what it would cost to rebuild it today, in the same place, to the same specification. That's the number a cat model wants for the building coverage line.
Where this breaks down
Footprint area isn't floor plate. A building with setbacks, courtyards, or an atrium has a footprint bigger than any single floor. Story count from imagery or a building outline dataset is a reasonable proxy for most low-rise commercial stock, but it undercounts mezzanines and overcounts anything with double-height lobbies or parking podiums you can't see from above.
Mixed-use is the other failure mode. A five-story building with retail on the ground floor and residential above has two occupancy classes and two cost multipliers under one footprint. Treat it as a single use and the replacement cost estimate drifts in whichever direction the dominant floor count pulls it.
None of this means the method is wrong. It means the output is a first-pass number you reconcile against whatever submission data exists, not a replacement for it. Where a schedule gives you declared values, use them. Where it gives you nothing, or gives you a TIV for a parcel that now has three buildings instead of one, footprint times stories times a cost table is the fastest way to get a number on the page instead of a blank cell.
Where the footprint itself comes from
Everything above assumes you already have a current footprint and an accurate story count for every structure in the treaty. For a single site that's a site visit or a Street View check. For a portfolio spanning a territory, it's the part that actually eats the week before renewal, because self-reported schedules go stale the moment a market builds, rebuilds, or adds a floor nobody told the broker about.
That's the gap Exposure Mapping is built to close: a current footprint and rough form layer pulled from annual high-resolution satellite imagery, so the inputs to this build-up reflect what's standing now rather than what was declared at the last renewal.
Run the reconciliation both ways where you can. If the footprint-derived estimate and the submission-derived TIV land within a reasonable band, you've got confirmation. If they diverge by a wide margin, that divergence is itself the finding, it tells you the schedule is out of date, the occupancy code is wrong, or the parcel has been redeveloped since the last data pull. Either way, you know more than the blank cell told you.
If you're loading footprint and story-count data across a treaty rather than one building at a time, that's the use case Exposure Mapping is built around.